Buy Low, Sell 13 Months Later: The Fastest Condo Flips in NYC
Five boroughs, 25 flips, and one penthouse that tripled its money thirty times over.
So, setup. I loaded 5.4 million NYC condo transactions into a database, and then I asked it the question every dinner party in the city eventually arrives at: who bought something and sold it again embarrassingly fast, for embarrassingly more money?
The answer is a penthouse on Franklin Street that went from $359,500 to $10,997,100 in thirteen months, which is a gain of 2,959 percent, and which I verified three times because the first two times I assumed I had joined the wrong tables.
I had not joined the wrong tables. Below is the full ranking, five flips per borough, every one of them a pair of paid deeds where the buyer of the first sale is the seller of the second, both sales over $300,000, three to twenty-four months apart. No sampling, no vibes, just SQL and mild obsession.
The Sponsor Discount (Manhattan)
Manhattan does not flip condos so much as it reprices them, and the repricing starts with the sponsor. The Franklin Street penthouse was sold by 88 Franklin Street Group LLC, which is the building sponsor, to Little Hearts Marks Family LP for $359,500 in December 2012, and thirteen months later that same LP sold it to KKEDG LLC for just under $11 million.
LITTLE HEARTS MARKS FAMILY LP → KKEDG LLC ($10,997,100) · Jan 2014
The boring answer is almost certainly the right one, which is that the first price was insider pricing and the second price was the market, and the $10.6 million gap between them is what a sponsor discount looks like when you measure it instead of gossiping about it. Runner-up honors go to 157 Hudson Street, unit P7, which went from $345,459 to $9,466,100 in ten months through three LLCs in a row, a relay race where the baton is a parking-sized condo and every runner is a Delaware filing.
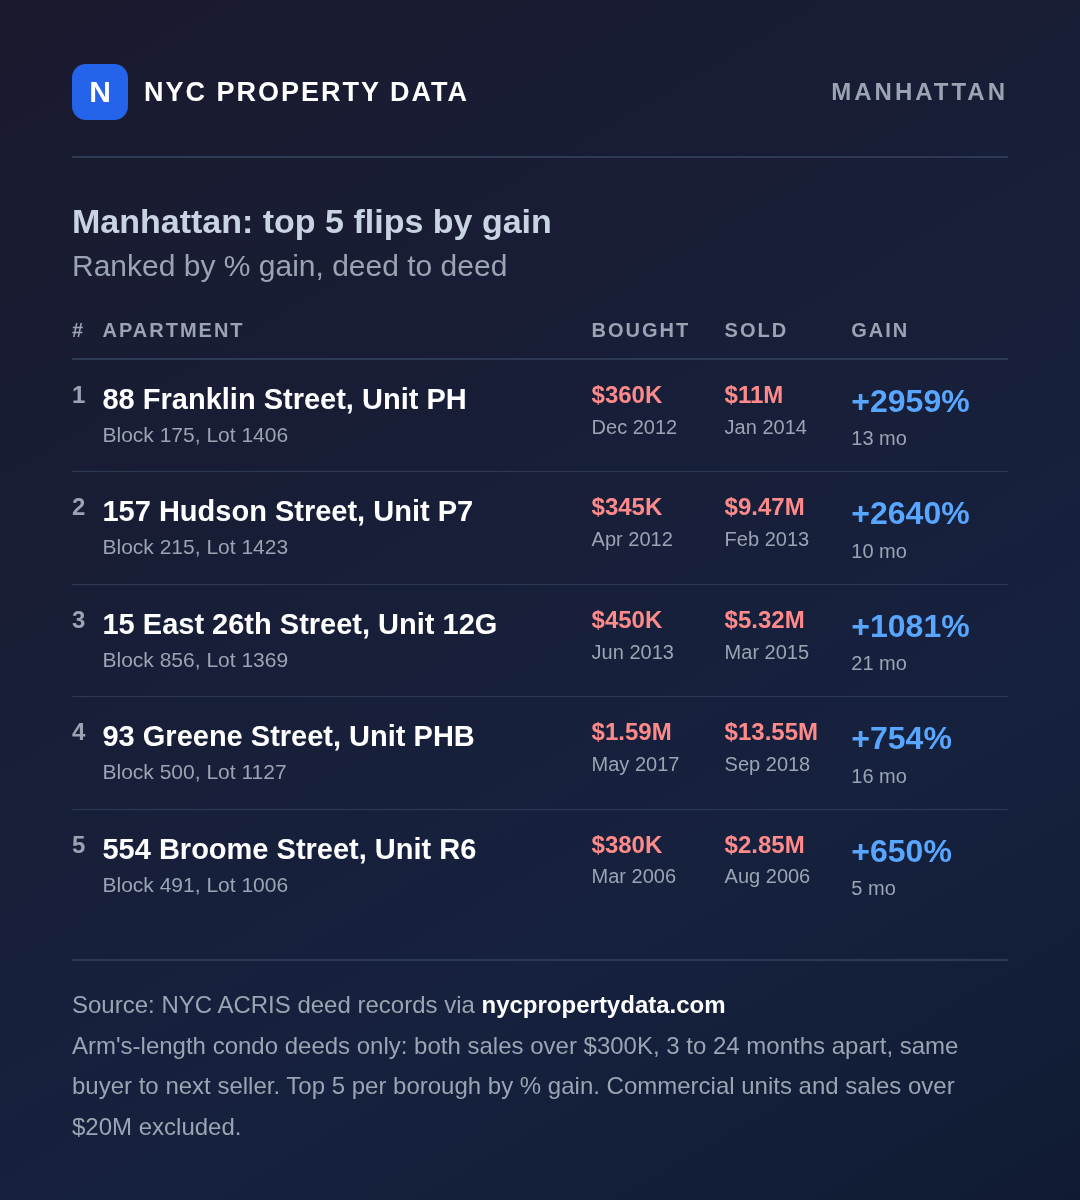
| Apartment | Bought | Sold | Gain |
|---|---|---|---|
| 88 Franklin St, Unit PH | $359,500 · Dec 2012 | $10,997,100 · Jan 2014 | +2,959% (13 mo) |
| 157 Hudson St, Unit P7 | $345,459 · Apr 2012 | $9,466,100 · Feb 2013 | +2,640% (10 mo) |
| 15 E 26th St, Unit 12G | $450,000 · Jun 2013 | $5,315,000 · Mar 2015 | +1,081% (21 mo) |
| 93 Greene St, Unit PHB | $1,585,951 · May 2017 | $13,550,000 · Sep 2018 | +754% (16 mo) |
| 554 Broome St, Unit R6 | $380,250 · Mar 2006 | $2,850,000 · Aug 2006 | +650% (5 mo) |
The Buyout That Counted as a Flip (Brooklyn)
Brooklyn's number one entry comes with an asterisk I am disclosing because I checked, because obviously I checked. Unit 8G at 2 Northside Piers was bought for $305,475 in September 2023 by Einar Brendalen out of a co-ownership with Ryan Jo Bongseek Joo, and sold for $1,430,000 that December, which means the "flip" was really one co-owner buying out the other and then selling the whole place, and the 368 percent gain is measured against a half-interest buyout rather than a market purchase.
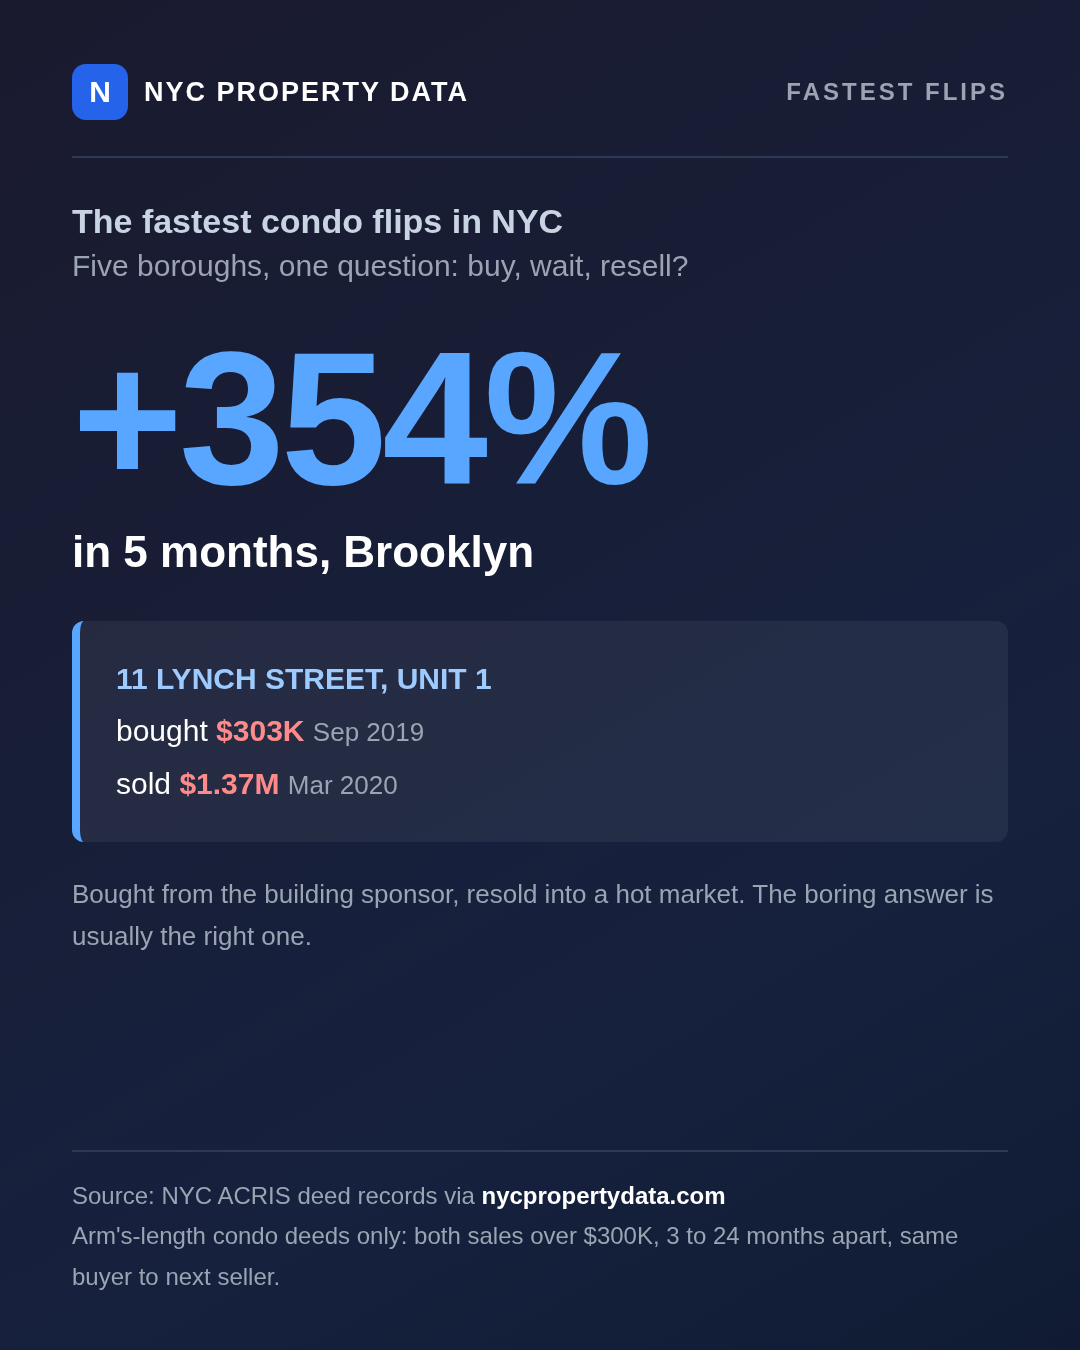
It still counts under my rules, and I am keeping it in the table, because rules disclosed in advance beat vibes every time. The cleaner story is right below it: 11 Lynch Street, unit 1, bought from the Lynch family partnership for $303,000 in September 2019 and resold to Joel Silberstein for $1,374,638 in March 2020, a 354 percent gain in five months that started, once again, with the sponsor side of the table selling cheap.
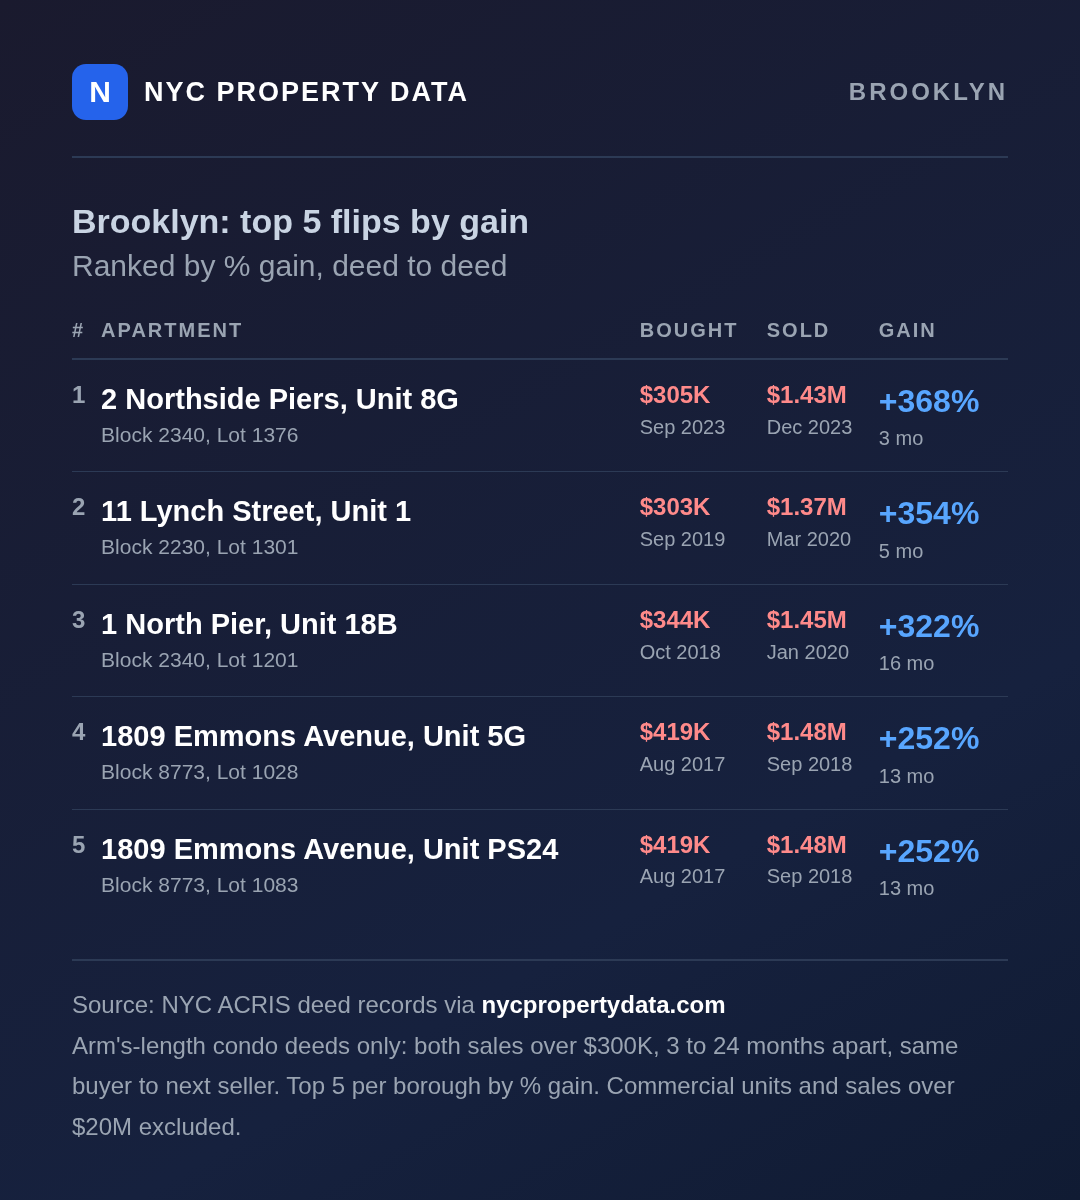
| Apartment | Bought | Sold | Gain |
|---|---|---|---|
| 2 Northside Piers, Unit 8G | $305,475 · Sep 2023 | $1,430,000 · Dec 2023 | +368% (3 mo) |
| 11 Lynch St, Unit 1 | $303,000 · Sep 2019 | $1,374,638 · Mar 2020 | +354% (5 mo) |
| 1 North Pier, Unit 18B | $344,000 · Oct 2018 | $1,450,000 · Jan 2020 | +322% (16 mo) |
| 1809 Emmons Ave, Unit 5G | $418,941 · Aug 2017 | $1,476,463 · Sep 2018 | +252% (13 mo) |
| 1809 Emmons Ave, Unit PS24 | $418,941 · Aug 2017 | $1,476,463 · Sep 2018 | +252% (13 mo) |
The Stonecutter Special (Queens)
Queens has the most corporate-looking winner of the five boroughs. Unit 1A at 42-60 Crescent Street went from RDG Stonecutter 43rd Ave Owner LLC to M.T. Crescent St LLC for $1,390,838 in June 2017, and then to One Dragon LLC for $3,790,000 in February 2019, a 172 percent gain that tripled the money while everyone involved had LLC in their name, which is how you know the dragon in question files quarterly reports.
Right behind it, four units at 71-28 163rd Street all flipped on the same day in September 2014 for the same $1,860,000 after being bought that May for $712,774 each, which is either a bulk investor exit or four neighbors with remarkable synchronicity, and the deeds say it was the former.
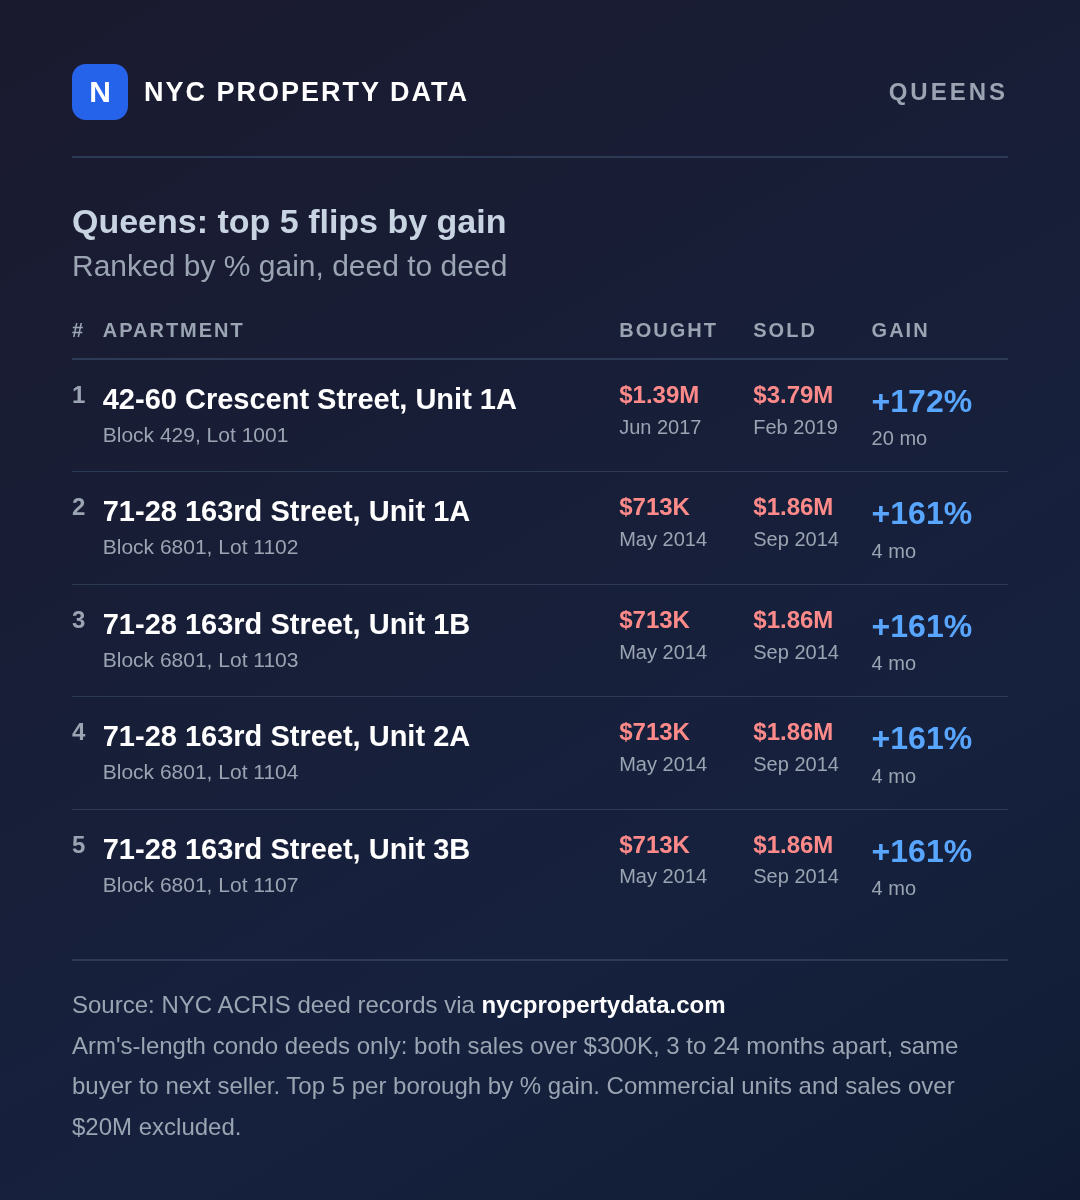
| Apartment | Bought | Sold | Gain |
|---|---|---|---|
| 42-60 Crescent St, Unit 1A | $1,390,838 · Jun 2017 | $3,790,000 · Feb 2019 | +172% (20 mo) |
| 71-28 163rd St, Unit 1A | $712,774 · May 2014 | $1,860,000 · Sep 2014 | +161% (4 mo) |
| 71-28 163rd St, Unit 1B | $712,774 · May 2014 | $1,860,000 · Sep 2014 | +161% (4 mo) |
| 71-28 163rd St, Unit 2A | $712,774 · May 2014 | $1,860,000 · Sep 2014 | +161% (4 mo) |
| 71-28 163rd St, Unit 3B | $712,774 · May 2014 | $1,860,000 · Sep 2014 | +161% (4 mo) |
The Honest Borough (The Bronx)
The Bronx list is my favorite precisely because it is the smallest. The gains run from 46 to 87 percent, the buyers and sellers are mostly people with first and last names instead of LLCs with Roman numerals, and a townhouse on Douglas Avenue bought from a family trust for $857,000 and sold to a couple named Birchard for $1,600,000 reads like actual housing changing hands instead of paperwork doing calisthenics.
This is what a normal flip market looks like, and it tops out where Manhattan's list barely gets started, which tells you most of what you need to know about the two markets and the remaining part is in the tables above.
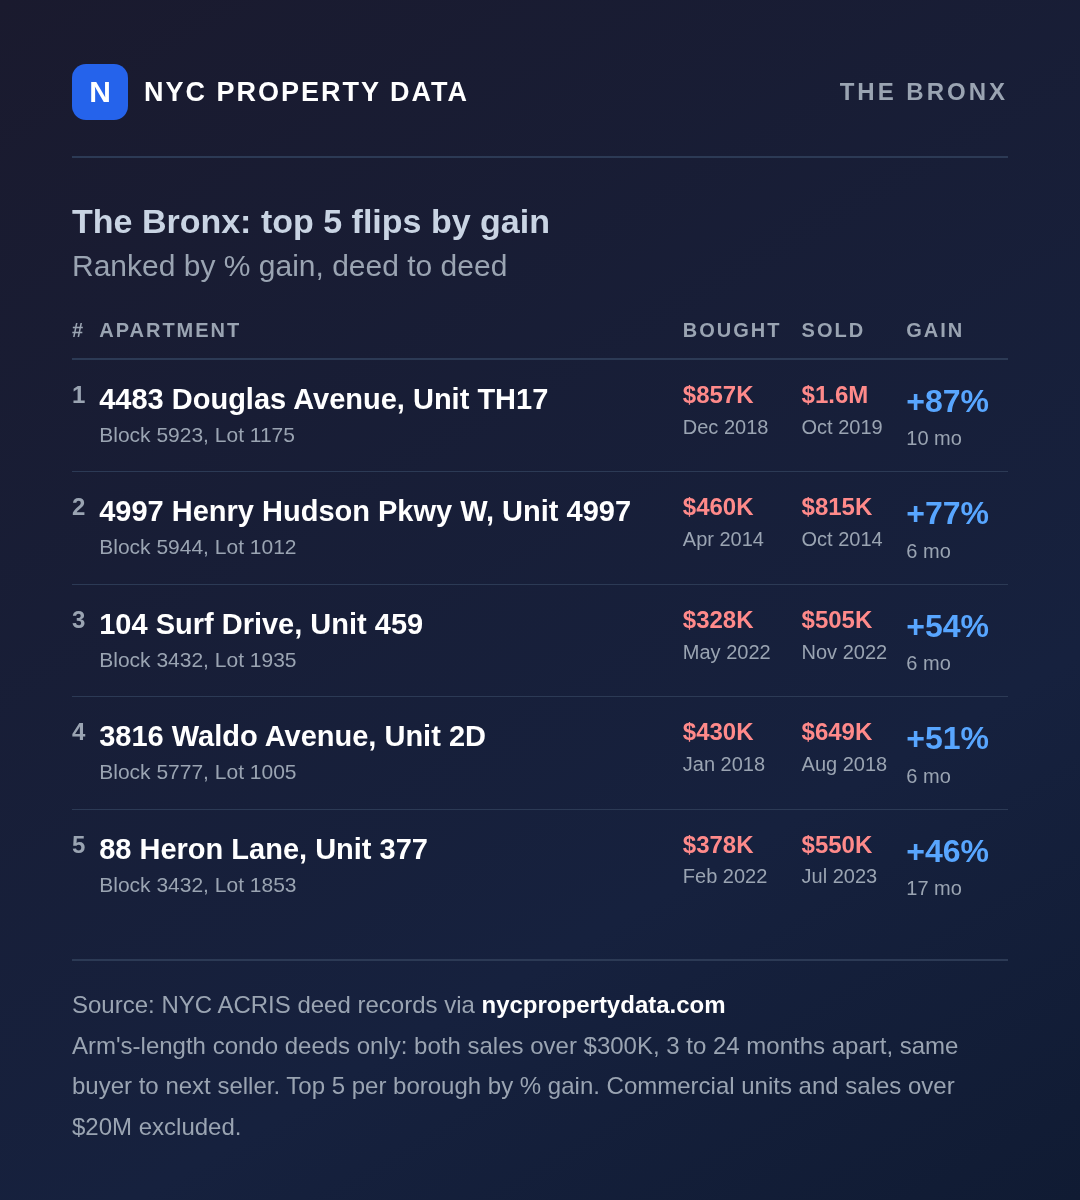
| Apartment | Bought | Sold | Gain |
|---|---|---|---|
| 4483 Douglas Ave, Unit TH17 | $857,000 · Dec 2018 | $1,600,000 · Oct 2019 | +87% (10 mo) |
| 4997 Henry Hudson Pkwy W, Unit 4997 | $460,000 · Apr 2014 | $815,000 · Oct 2014 | +77% (6 mo) |
| 104 Surf Dr, Unit 459 | $327,522 · May 2022 | $505,000 · Nov 2022 | +54% (6 mo) |
| 3816 Waldo Ave, Unit 2D | $430,000 · Jan 2018 | $649,000 · Aug 2018 | +51% (6 mo) |
| 88 Heron Ln, Unit 377 | $378,000 · Feb 2022 | $550,000 · Jul 2023 | +46% (17 mo) |
The RPTT Republic (Staten Island)
Staten Island has no deeds in my database, not because nothing sells there but because its condo transfers arrive as RPTT transfer-tax filings instead of deed records, a paperwork quirk I wrote up in the import notes after staring at an empty query result for longer than I will admit. Running the same flip rules against RPTT pairs produces a tidy little list topped by 138 Russek Drive, bought by JM Trinity Holdings LLC for $320,000 in September 2021 and sold for $625,000 six months later, a 95 percent gain that would not crack the top twenty in Manhattan and leads Staten Island by a mile.
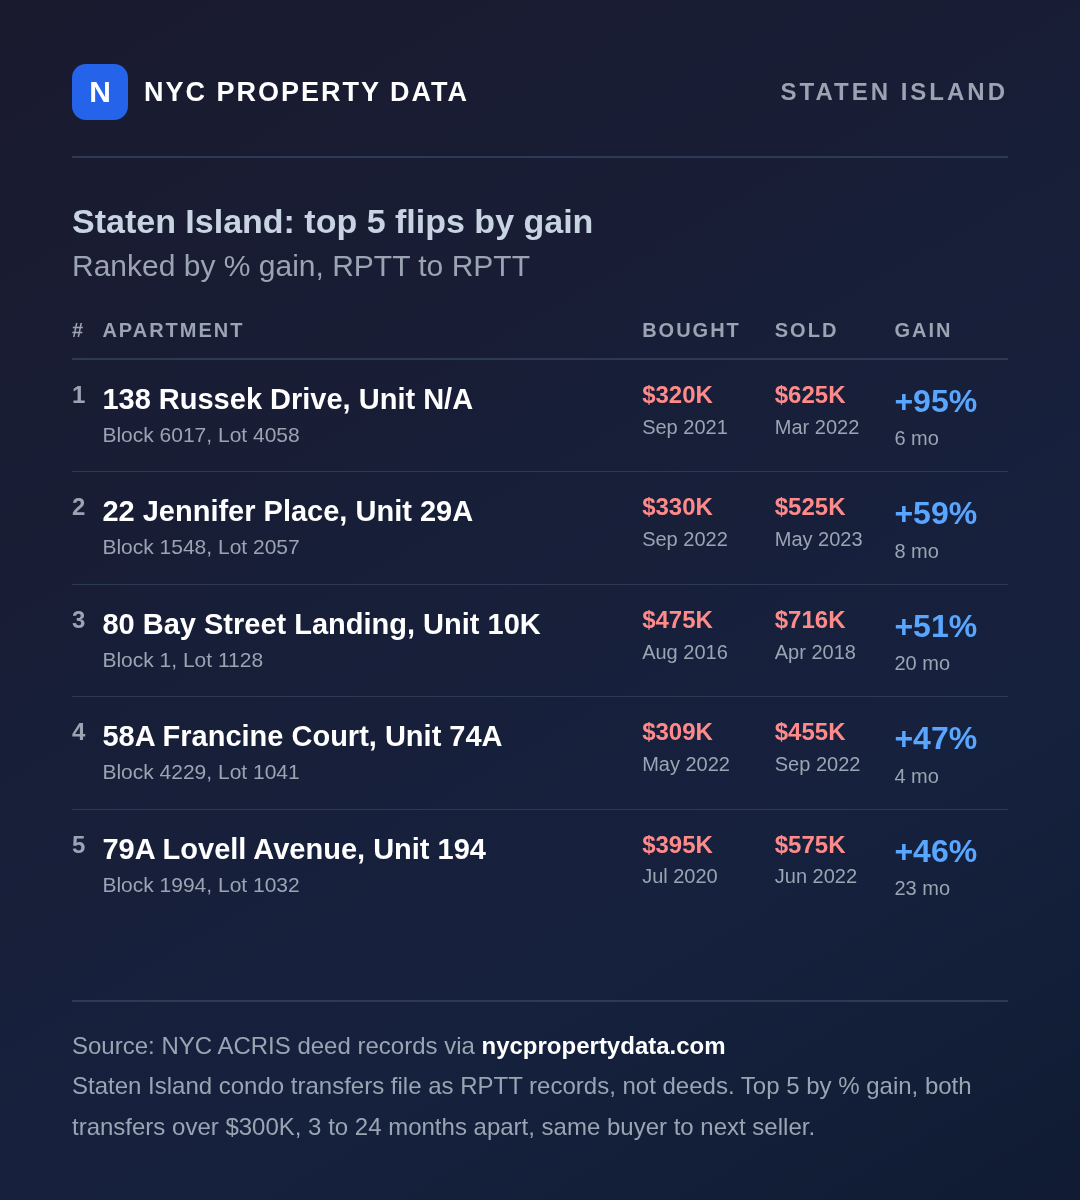
| Apartment | Bought | Sold | Gain |
|---|---|---|---|
| 138 Russek Dr, Unit N/A | $320,000 · Sep 2021 | $625,000 · Mar 2022 | +95% (6 mo) |
| 22 Jennifer Pl, Unit 29A | $329,550 · Sep 2022 | $525,000 · May 2023 | +59% (8 mo) |
| 80 Bay Street Landing, Unit 10K | $475,000 · Aug 2016 | $716,500 · Apr 2018 | +51% (20 mo) |
| 58A Francine Ct, Unit 74A | $309,270 · May 2022 | $455,000 · Sep 2022 | +47% (4 mo) |
| 79A Lovell Ave, Unit 194 | $395,000 · Jul 2020 | $575,000 · Jun 2022 | +46% (23 mo) |
Caveats (The Part Where I'm Sober)
To be extremely clear, because this is the paragraph that gets screenshotted: a big percentage on a deed pair is not the same thing as a big profit. I have no data on renovations, carrying costs, transfer taxes, broker fees, or mortgage interest, and several of these first legs are sponsor sales, co-owner buyouts, or entity restructurings where the stated price is not a market price. The deed says what money changed hands on paper, and the paper is the whole dataset.
Go Look Yourself
Everything in this post is in the database, and so is everything else:
- Browse by borough and drill down to individual buildings
- Click any apartment link in the tables above for its full deed history
- Search any party name for their full transaction history
The data was already public, because the city already published it, and I just made it so you can ask it questions without downloading a 40-gig zip file over hotel wifi.
Methodology, Or: What I Actually Did
This analysis is based on NYC's ACRIS datasets, the same 5.4 million condo transaction records behind the rest of this site. I joined each paid deed to the next paid deed on the same apartment where the buyer of the first is the seller of the second, both sales over $300,000, three to twenty-four months apart, and ranked the pairs by percentage gain. Commercial-looking units and sales over $20 million were excluded as bulk outliers. Staten Island has no deed records in the data, so its table uses RPTT transfer-tax pairs under identical rules. No sampling, no vibes, just SQL and mild obsession.
All data sourced from NYC Open Data ACRIS, which the city published and I merely counted.